Experiment output directory#
This tutorial will familiarize you with the parallel experiment’s output folder structure, where some files can be viewed directly to quickly draw conclusions about the experiment’s results, some can be visualized in tensorboard, and some can be used to create custom visualizations with the `ablator.analysis module <../analysis.rst>`__.
Experiment output folder structure#
After running the experiments from Hyperparameter Optimization tutorial, you can inspect the results saved in the following folder: /tmp/experiments (specified in the configurations parallel_config.experiment_dir). The directory follows the following structure:
- tmp/experiments
    - experiment_<experiment_id>
        - <trial1_id>
          - best_checkpoints/
          - checkpoints/
          - dashboard/
          - config.yaml
          - metadata.json
          - results.json
          - train.log
        - <trial2_id>
        - <trial3_id>
        - ...
        - <experiment_id>_optuna.db
        - <experiment_id>_state.db
        - default_config.yaml
        - mp.log
As you can see, there are two levels of directories: one for the ablation experiment and one for the trials.
The experiment_<experiment_id> directory#
This directory contains:
<experiment_id>_optuna.db: for each trial, after finishing training, its metrics (those to be optimized) will be recorded to the experiment state database (viaoptuna_study.tell()). Optuna will use this as a base to explore the search space based on the results so far. The content of this database is out of this tutorial’s scope since it’s used byoptunato perform hyperparameters exploration.<experiment_id>_state.db: for each trial, after finishing training, its metrics (those to be optimized), configuration, and training state (RUNNING, WAITING, etc.), will be added to the experiment state database.default_config.yaml: the overall configurations of the experiment. Note that configurations for hyperparameters will be changed in each trial’sconfig.yamlfile that’s specific to that trial only.mp.log: console infomation during the running experiment. This gives information about the trials that are running in parallel, how many that are running, and how many that are terminated.
The trial directories#
Corresponding to each trial, a folder named by the trial’s id will be created, each contains:
train.log: this log reports metrics from training and evaluation of the training process of the trial. These metrics include static (e.g., best loss value, the current iteration, current epoch, best iteration so far, total steps, current learning rate) and moving average metrics (e.g., training loss, validation loss, user-defined metrics like f1 score, precision, etc.).results.json: helps keep track of the running trial. This includes a JSON object for each of the epochs. This is where all metrics in thetrain.logare stored as JSON objects.
{
"train_loss": 0.5761058599829674,
"val_loss": NaN,
"train_accuracy": 0.855390625,
"val_accuracy": NaN,
"best_iteration": 0,
"best_loss": Infinity,
"current_epoch": 1,
"current_iteration": 1875,
"epochs": 10,
"learning_rate": 0.008175538431326259,
"total_steps": 18750
},
{
"train_loss": 0.3937998796661695,
"val_loss": 0.42723633049014276,
"train_accuracy": 0.8599609374999999,
"val_accuracy": 0.8481,
"best_iteration": 1875,
"best_loss": 0.42723633049014276,
"current_epoch": 2,
"current_iteration": 3750,
"epochs": 10,
"learning_rate": 0.008175538431326259,
"total_steps": 18750
},
...
{
"train_loss": 0.3794497859179974,
"val_loss": 0.4047809976875782,
"train_accuracy": 0.86644921875,
"val_accuracy": 0.8576999999999999,
"best_iteration": 15000,
"best_loss": 0.3985074917415778,
"current_epoch": 10,
"current_iteration": 18750,
"epochs": 10,
"learning_rate": 0.008175538431326259,
"total_steps": 18750
}
As you can observe from this sample results.json file from HPO tutorial, there are 10 JSON objects, each representing metrics of one epoch. best_iteration and best_loss values give us information about the best-performing iteration.
config.yaml: configuration details that are specific to the trial.checkpoints/: this directory stores checkpoints that are saved during the training process. Each checkpoint includes the model state, the optimizer (and/or scheduler) state, and all the metrics this model has generated. Config parameterkeep_n_checkpointsfrom the running configuration controls the number of checkpoints kept in this folder. You can play around with the checkpoint files by loading the.ptfile with pytorch. For example, you can load the model parameters and optimizer state with the following code:
import torch

checkpoint_path = "tmp/experiments/experiment_<experiment_id>/<trial1_id>/checkpoints/<ckpt_name>.pt"
torch.load(checkpoint_path, map_location="cpu")
{'run_config': {'model_config': {'num_filter1': 47,
'num_filter2': 74,
'activation': 'relu'},
'experiment_dir': '/content/experiments/experiment_5ade_3be2',
'random_seed': 42,
'train_config': {...},
'scheduler_config': None,
'rand_weights_init': True}
'search_space': {...},
'optim_metrics': {'val_loss': <Optim.min: 'min'>},,
'metrics': {'train_loss': 0.37417657624085743,
  'val_loss': 0.3985074917415778,
  'train_accuracy': 0.8660498046875,},
'model': OrderedDict([('model.conv1.weight',
              tensor([[[[-3.0586e-01,  1.4900e-01, -4.6661e-01],
                        [ 2.4052e-01, -5.5201e-01, -2.5857e-01],
                        [-2.9385e-01, -1.5303e+00, -9.4572e-01]]],
                      ])),...
                      ]),
'optimizer': {'state': {0: {'step': tensor(14992.),...}}}
...
}
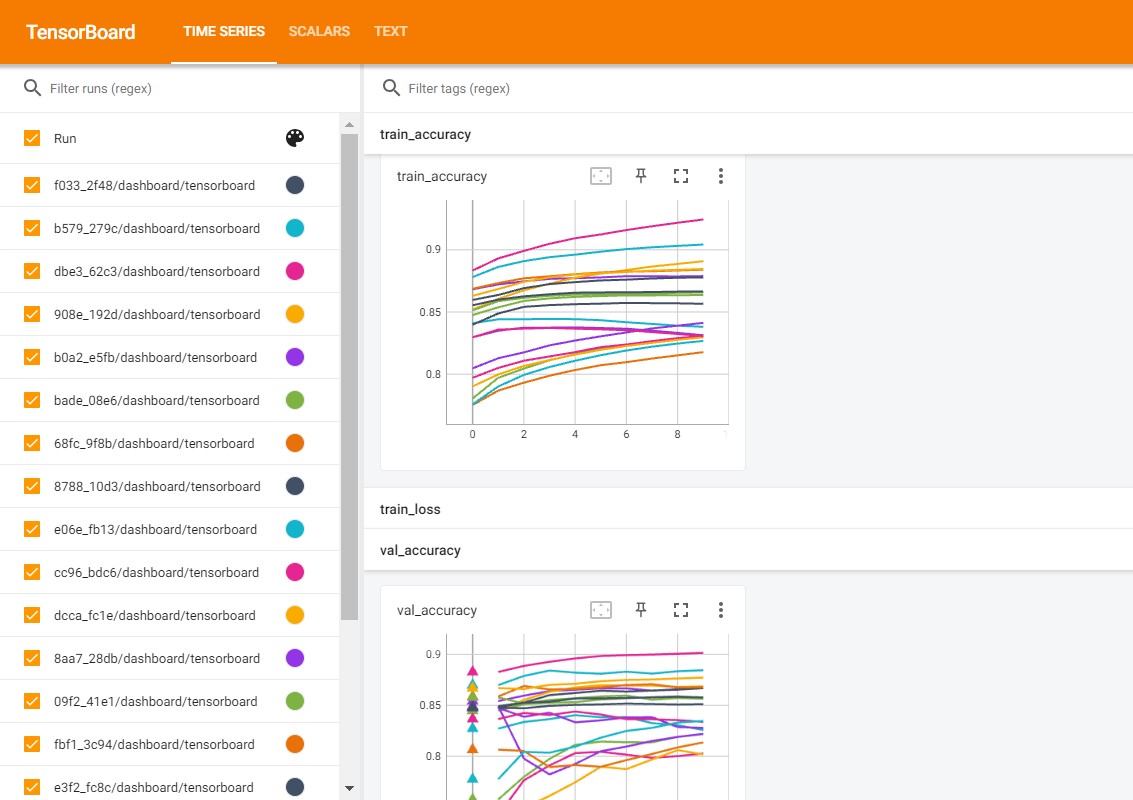
best_checkpoints: this directory stores the checkpoints that perform the best.dashboard/: ablator automatically write metrics to this directory, and you can use Tensorboard to visualize how metrics oscillate while training:Install
tensorboardand load using%load_ext tensorboardif using notebookThen run
%tensorboard --logdir /tmp/experiments/experiment_<experiment_id> --port [port]. E.g.:%load_ext tensorboard %tensorboard --logdir /tmp/experiments/experiment_5ade_3be2 --port 6008
metadata.json: keeps track of the training progress: log iteration (specifies the latest iteration that logs the results to files), checkpoint iteration specifies which iteration a checkpoint has been saved and which iteration is the best one.
Conclusion#
In this tutorial, we quickly look through the experiment output directory and discover how we can use some of them to help study the experiment. In the following tutorial, we will use the `ablator.analysis module <../analysis.rst>`__ to visualize these results to get some conclusion on the ablation study of the experiment.